Medicare Enrollment Dashboard
Medicare Enrollment

I built a Medicare Enrollment Dashboard in a Single HTML File — Here’s What It Took (and Why It Matters)
Published on EzIntel · ezintel.substack.com
Within the Medicare Advantage enrollment operations, the complexity is real. The stakes are high because we’re talking about revenue integrity, CMS compliance, member experience, and operational automation across millions of beneficiaries. But the moment you open a slide deck or pull up a process flow diagram, eyes glaze over.
So I built a prototype instead.
The result is a Medicare Enrollment Operations Dashboard that visualizes the end-to-end enrollment pipeline, billing reconciliation, and operational health of a Medicare Advantage + PDP plan operation. No backend. No database. No API calls.
You can interact with it here: https://pihub.cloud/medicare-enrollment-dashboard/
Why Medicare MAPD Enrollment Is Hard to Explain
Because complexity is high and complexity drivers include:
Dual eligibility (members covered by both Medicare and Medicaid)
Special Enrollment Periods (SEP) and Open Enrollment Periods (OEP) with retroactive effective dates
CMS TRR/T-MSIS data feeds that must reconcile against internal enrollment records
Revenue integrity requirements around CMS Part C and Part D payments
Stars quality program gates that track enrollment accuracy as a quality measure
What the Dashboard Shows (synthetic data, no PHI)
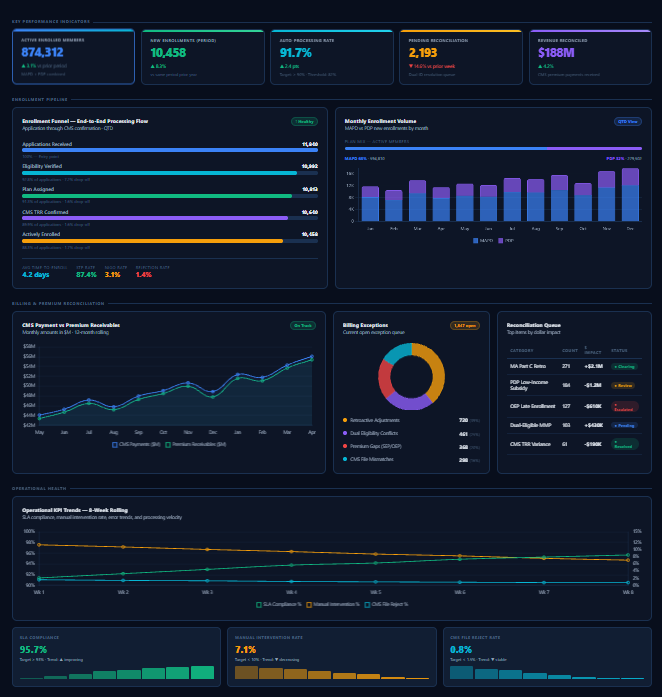
KPI Strip
Five headline metrics anchor the view: active enrolled members (874K), new enrollments in period, auto-processing rate (the percentage of enrollments that clear without human intervention), pending reconciliation items, and total revenue reconciled against CMS.
The auto-processing rate is the most operationally important. Every enrollment that requires manual intervention costs time, money, and introduces error risk. The goal is to keep this above 90% and keep it there.
Enrollment Funnel
The funnel shows the enrollment pipeline from application receipt through CMS TRR confirmation to active enrollment. Each stage shows volume and drop-off rate. Three summary metrics anchor the bottom:
Time-to-Enroll (TTE): 5.1 days — the elapsed time from application to active coverage
Straight-Through Processing (STP) rate: 83.6% — enrollments that require zero manual steps
NIGO rate (Not-in-Good-Order): 4.2% — applications rejected for missing or invalid information
You can filter the entire funnel by plan type (All / MAPD / PDP) and time period (MTD / QTD / YTD). The MAPD path has a higher STP rate (93.4%) than PDP (88.1%), which reflects the additional eligibility complexity on the drug plan side — LIS/IRMAA calculations, formulary matching, and prior authorization status.
Billing & Premium Reconciliation
Has three components:
CMS Payment vs Premium Receivables (line chart): CMS pays plans a monthly capitation payment based on the enrolled population’s risk scores. Premium receivables are the member premiums collected. When these diverge due to retroactive enrollment changes, disenrollments, or TRR discrepancies, the variance enters the reconciliation queue.
Billing Exception Donut: ~2900 open exceptions broken into four categories:
Retroactive Adjustments (40%) — enrollment effective date changes that require retroactive premium recalculation
Dual Eligibility Conflicts (25%) — members with both Medicare and Medicaid coverage require coordination with State Medicaid agencies
Premium Gaps from SEP/OEP (20%) — late or retroactive enrollment periods creating billing gaps
CMS File Mismatches (15%) — TRR/T-MSIS discrepancies between CMS records and internal enrollment system of record
Reconciliation Queue Table: Top items ranked by dollar impact. This is the daily work of a Revenue Integrity team i.e. triaging the queue, clearing items, escalating exceptions that need CMS intervention.
Operational Health
Eight-week trend lines for SLA compliance (96%, trending up), manual intervention rate (7%, trending down), and CMS file reject rate (0.8%, below the 1.5% target).
What This Represents Operationally
The dashboard represents the decision support a mature, purpose-built enrollment operations platform should surface.
Notably,
Where in the funnel volume is dropping (and whether it’s a data quality issue, a CMS timing issue, or a process break)
Which exception categories are growing and why
Whether the auto-processing rate trend is moving in the right direction — and at what pace
Where the reconciliation queue poses the biggest revenue risk
That is the actual product vision of a mature Medicare enrollment platform: replacing reactive, manual, spreadsheet-driven operations with a system that proactively surfaces the right information to the right person at the right time.